| Fiscal Year | Revenue | Net income | Assets | Liabilities | Stockholders' Equity | Earnings per share |
Q2 25 | $1.0B | $169M | $10.3B | $5.2B | $5.2B | $0.38 |
Q1 25 | $0.7B | $45M | $7.5B | $2.5B | $5.0B | $0.10 |
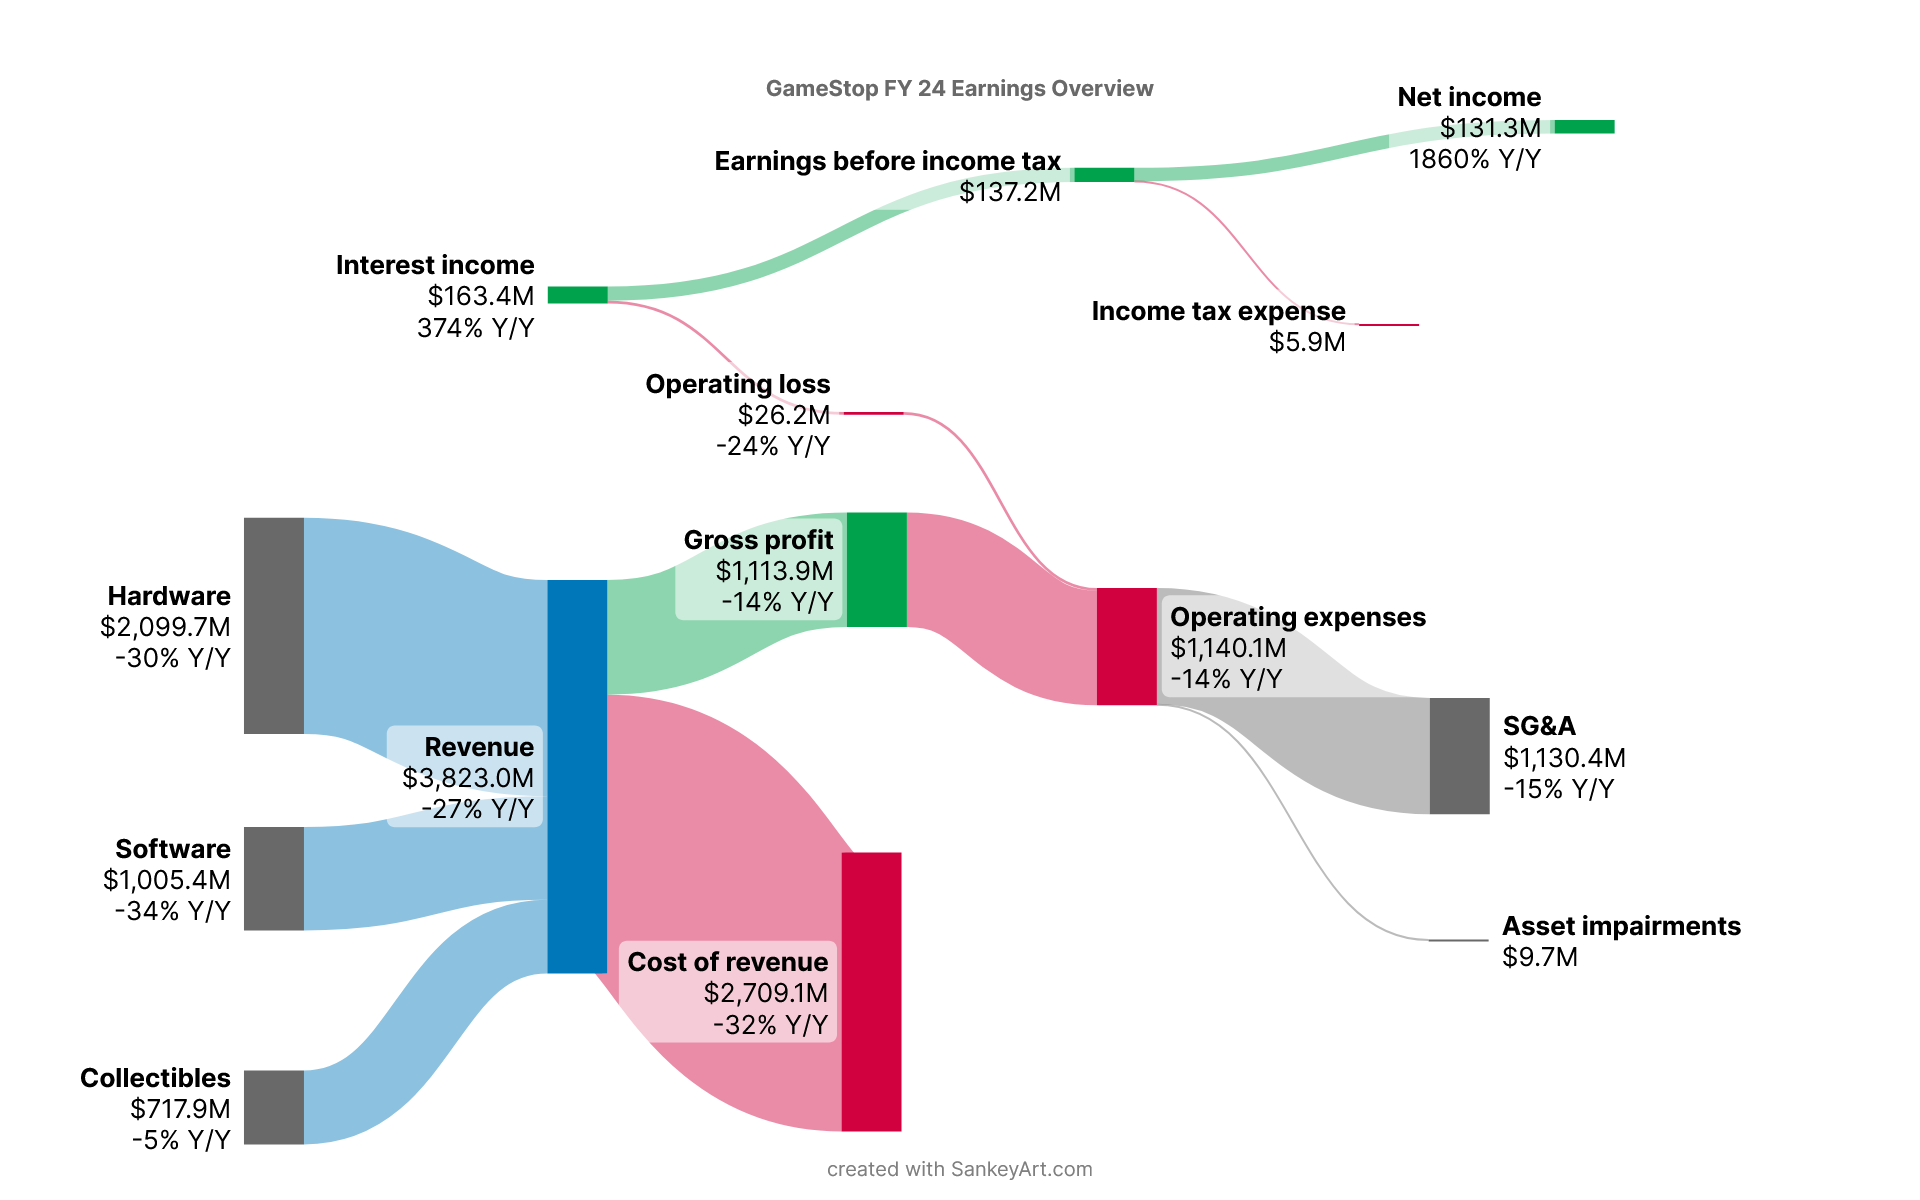
Q4 24 | $1.3B | $131M | $5.9B | $0.9B | $4.9B | $0.33 |
Q3 24 | $0.9B | $17M | $5.6B | $1.1B | $4.8B | $0.04 |
Q2 24 | $0.8B | $15M | $5.5B | $1.2B | $4.4B | $0.04 |
Q1 24 | $0.9B | -$32M | $2.6B | $1.3B | $1.3B | -$0.11 |
Q4 23 | $1.8B | $63M | $2.7B | $1.4B | $1.4B | $0.22 |
Q3 23 | $1.1B | -$3M | $3.1B | $1.9B | $1.3B | -$0.01 |
| Fiscal Year | Q1 | Q2 | Q3 | Q4 |
| 2025 | ||||
| 2024 | ||||
| 2023 | ||||
| 2022 | ||||
| 2021 | ||||
| 2020 | ||||
| 2019 | ||||
| 2018 |
Generally the business is much more efficient. It's gonna be a smaller — less stores — but more profitable company.
Most importantly, we're generating profits every single quarter now.
Typically in the past GameStop has only made money in Q3 and Q4, and actually, when I joined the board and before I joined the board, GameStop was losing money every single year.
It's hard to appreciate what a piece of crap the business was when I joined the board and what was going on in the boardroom and management. But, we're making progress.
We are in a position today where the retail business is profitable. Maybe the future value when you think about GameStop has more to do — again, this is a guess — but it may have more to do with how we deploy our balance sheet than the cash that the retail operations will generate.
But, it needs to be the right time, and the capital markets are funny. They can go — and this happens every 5 or 10 years — they go from green to red and they don't flash yellow. And so, there may be an opportunity tomorrow, you never know. We could wake up tomorrow and the markets could be down twenty percent and GameStop will be in a position to take advantage of those opportunities when they happen. We'll look everywhere.